Steam & Boilers
Temperature and Enthalpy Curve for Water at Atmospheric Pressure
Exam reference: SG-0001 (the label exam questions use for this figure)
What the figure shows
A graph with temperature in degrees F on the vertical axis and BTU per pound of water on the horizontal axis. The line rises from 0 to 32, runs flat at 32, rises to 212, runs flat at 212, then climbs to 300. Regions are marked with circled numbers 1 to 5, letters A to C and brackets I, II and III.
How to read it
- Sloped parts of the line mean temperature is changing as heat is added or removed; flat parts mean a change of state at constant temperature.
- The flat at 32 F is the ice and water change; the flat at 212 F is the water and steam change.
- Check the direction stated in the question: heat loss reads the curve from right to left.
What exam questions ask
- With the substance losing heat, what process does region 4 represent? Steam giving up its latent heat of condensation and changing state to water at constant temperature.
Common mistakes
- Picking the heat-gain version: water absorbing latent heat while boiling describes the same flat region but in the wrong direction.
- Picking steam losing specific heat: that is the sloped superheated region, not the flat change of state.
Related figures
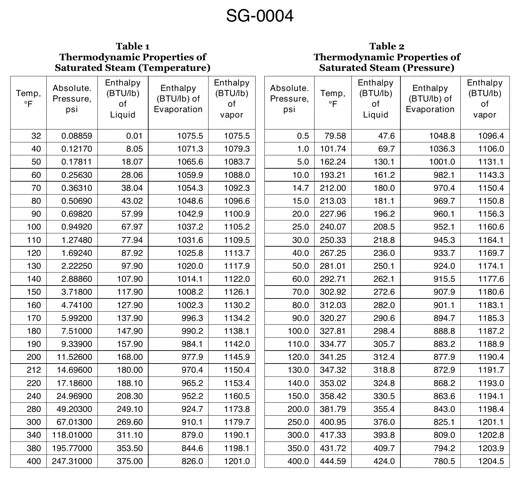 Steam & BoilersSaturated Steam Tables: Temperature, Pressure
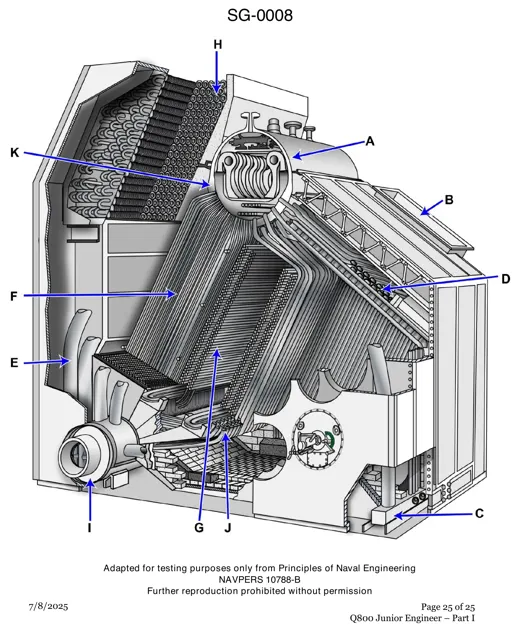 Steam & BoilersMarine D-Type Boiler Cutaway, Parts A to K
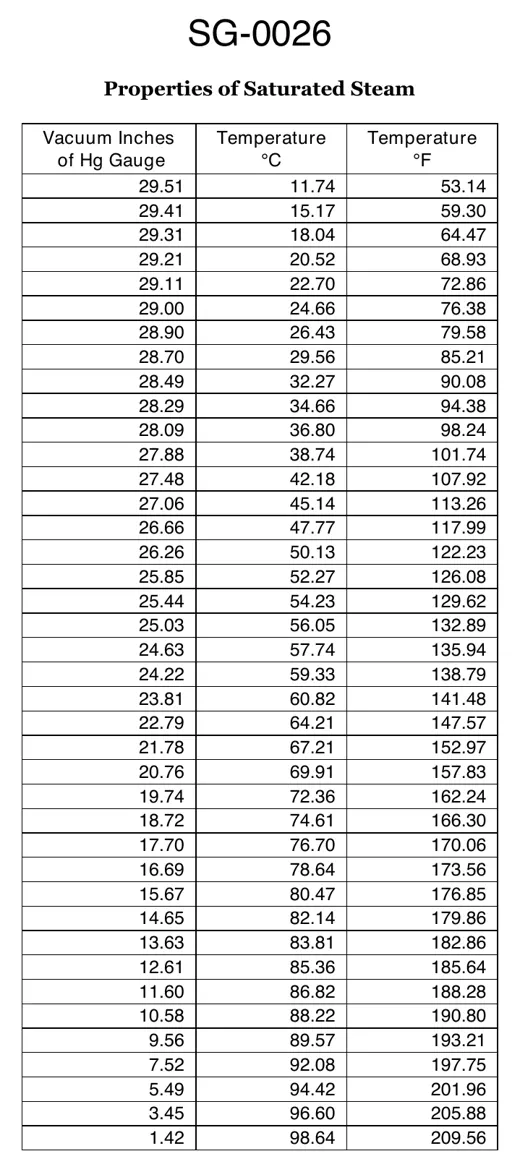 Steam & BoilersCondenser Vacuum vs. Steam Temperature Table
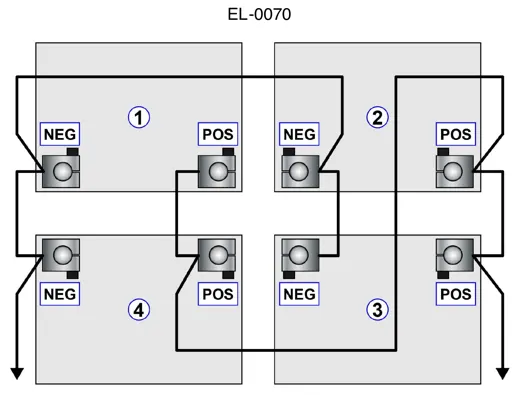 ElectricalFour 6-Volt Batteries in a Parallel Bank
 Engineering SafetyGlass Bulb Sprinkler Head Cross Section
 Engineering SafetySmoke and Air Flow in a Shipboard Fire