Tides & Currents
Tidal Current Prediction Graphs: Charleston Harbor, November 2023
Exam reference: D058NG (the label exam questions use for this figure)
What the figure shows
Two stacked line graphs of current speed in knots against date and time, 9 to 11 November 2023. The top graph is Fort Sumter Range Buoy 10, with speeds between about plus 0.3 and minus 0.4 knots. The bottom is Lower Town Creek Reach, with speeds between about plus 0.9 and minus 2.3 knots. Each title prints the mean flood and ebb directions.
How to read it
- Pick the right station: the top graph is Buoy 10 at the entrance, the bottom graph is the upriver station near the berth.
- Above the zero line is flood and below it is ebb; take the direction from the flood or ebb heading printed in that graph's title.
- On the top graph flood sets 280 degrees true and ebb 104; on the bottom graph flood sets 335 and ebb 172.
What exam questions ask
- What current do you meet passing Buoy 10 at a given date and time? Read the top graph at that time, decide flood or ebb, and pair the speed with that direction.
- What current will you meet approaching the berth after a transit? Divide distance by speed made good to get arrival time, then read the bottom graph at that time. For 15 miles at 10 knots, add 1.5 hours.
Common mistakes
- Right speed, wrong direction: a curve above zero is flood, so using the ebb heading at that time is wrong.
- Reading the wrong graph: values from the Buoy 10 graph do not apply at the berth, which uses the lower station.
Related figures
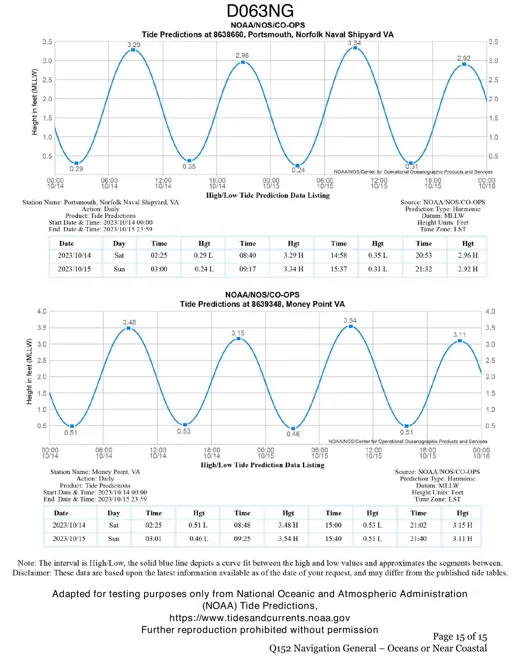 Tides & CurrentsTide Graphs: Portsmouth and Money Point, VA
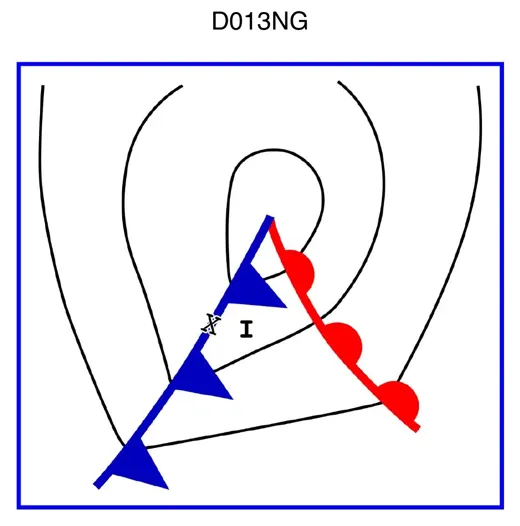 Deck & SeamanshipWeather Map: Warm Sector Near a Cold Front
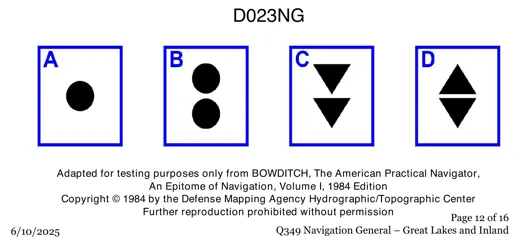 Deck & SeamanshipBuoy Topmarks: Spheres and Paired Cones
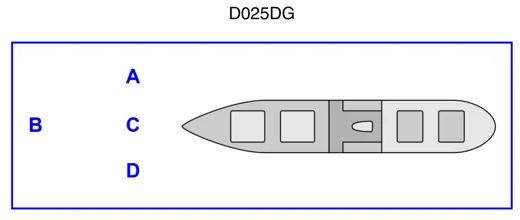 Deck & SeamanshipTaking a Disabled Vessel in Tow: Positions
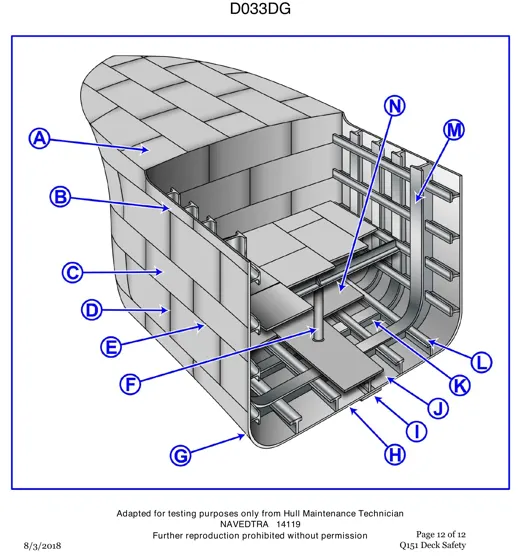 Deck & SeamanshipShip Bow Structure Cutaway, Parts A to N
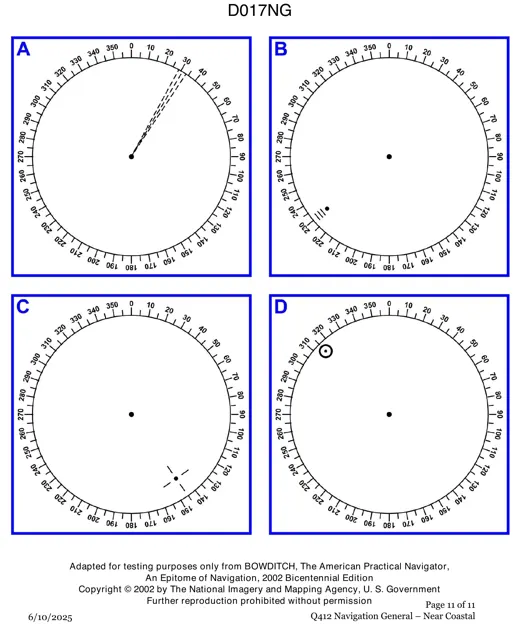 Navigation & ChartsRadar Screens: Spotting a Racon Response